Financial Reports in Money Pro — Profit & Loss, Balance Sheet, and More
Money Pro generates four core accounting statements — Profit & Loss, Balance Sheet, Cash Flow Statement, and Trial Balance — along with a full library of income, expense, mileage, invoicing, time, and tax reports. Access all of them under ZenBusiness Money → Reports in your dashboard. Each report can be filtered by date range and exported as PDF or Excel.
Profit & Loss (P&L)
The Profit & Loss statement shows your total income, total expenses, and net profit or loss for any period. It's the primary report lenders, investors, and accountants ask for, and the clearest view of whether your business is making money.
The P&L reflects every transaction and journal entry you've tracked, mapped to its General Ledger (GL) account. You can drill into any line to see the transactions behind it.

How to View the Profit & Loss
- Go to ZenBusiness Money → Reports
- Locate Profit & Loss and click View

Filtering the P&L
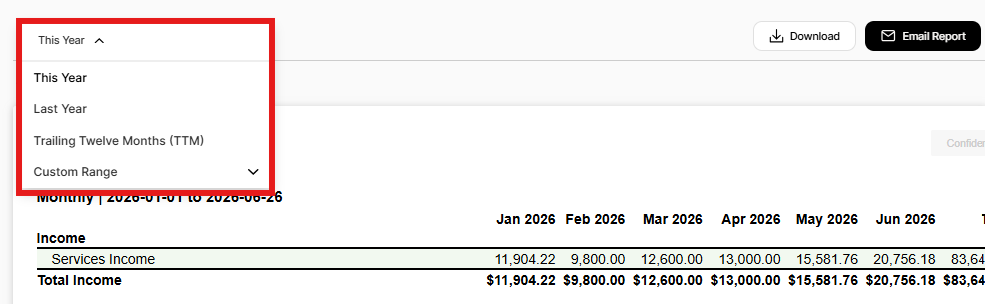
By default the P&L shows the past 6 months grouped by month.
Date range: Click the Date filter to select This Year, Last Year, Trailing Twelve Months, or a custom start/end date.
Grouping: Click the Grouping filter to compare periods side by side:
- None — single total for the selected date range
- Yearly — year-over-year comparison
- Quarterly — quarter-over-quarter
- Monthly — month-over-month

Drilling Down into the P&L
Click any GL account or amount in the P&L to see the individual transactions behind it:

You'll land in the General Ledger filtered to that account and timeframe, where you can review or edit transactions directly.
Exporting the P&L
- In Reports, click Profit & Loss
- Use filters to customize the date range and grouping
- Click Download or Email Report → choose PDF or XLS
Balance Sheet
The Balance Sheet is a snapshot of what your business owns (assets), owes (liabilities), and is worth (equity) at a specific point in time. Unlike the P&L (which covers a period), the Balance Sheet reflects your cumulative financial position as of the date you specify.
The Balance Sheet lists a subset of GL accounts grouped by account type: Asset, Liability, and Equity. When all three are in balance, your books are accurate.
How to View the Balance Sheet
- Go to ZenBusiness Money → Reports
- Locate Balance Sheet and click View

Filtering the Balance Sheet
By default the Balance Sheet shows the current year-to-date, grouped by month.
Date range: Click the Date filter to select This Year, This Month, Last Month, Last Year, Trailing Twelve Months, or a specific quarter.

Note: Balance Sheets can't be created for a specific period (like an expense report can) because they show a cumulative snapshot, not a period total. The end date of your filter determines the snapshot date.
Grouping: Use the Grouping filter to compare balances across periods (None, Yearly, Quarterly, Monthly).
Drilling Down into the Balance Sheet
Click any GL account or balance to see the transactions contributing to it, filtered by account and timeframe.
Exporting the Balance Sheet
- In Reports, click Balance Sheet
- Set your date range and grouping
- Click Download or Email Report → choose PDF or XLS
Cash Flow Statement
The Cash Flow Statement (CFS) shows how cash actually moved in and out of your business during a period — operating activities (day-to-day revenue and expenses), investing activities (buying or selling assets), and financing activities (equity and debt). It answers: "Where did the money come from and where did it go?"
Money Pro uses the indirect method for the CFS, which starts from net income and adjusts for non-cash items.
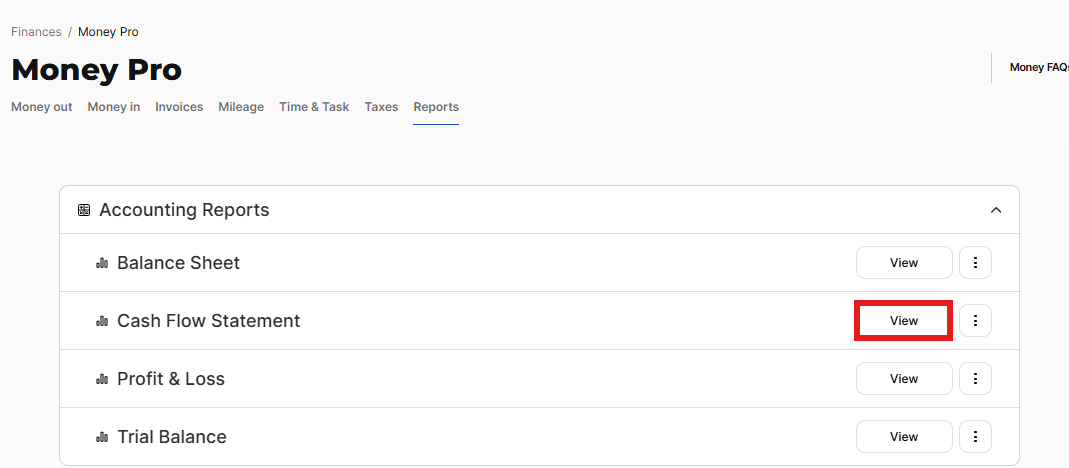
How to View the Cash Flow Statement
- Go to ZenBusiness Money → Reports
- Locate Cash Flow Statement and click View
By default, the CFS shows the current year with no grouping.

Filtering the Cash Flow Statement
Date range: Click the Date filter to select This Year, This Month, Last Month, Last Year, Trailing Twelve Months, or a specific quarter.

Grouping: Use the Grouping filter (None, Yearly, Quarterly, Monthly) to compare cash flow across periods.
Drilling Down and Exporting the Cash Flow Statement
Click any line in the CFS to see the underlying transactions. Export as PDF or XLS via Download or Email Report.
Trial Balance
The Trial Balance shows the opening balance, net debits/credits, and closing balance for every GL account over a period. It's a tool for verifying that your books are in balance — total debits equal total credits. Accountants use it to perform a high-level audit before preparing tax returns.
How to View the Trial Balance
- Go to ZenBusiness Money → Reports
- Locate Trial Balance and click View

By default, the Trial Balance shows the current year.

Filtering the Trial Balance
Date range: Click the Date filter to select any standard timeframe or a custom range.

Grouping: Use the Grouping filter to compare across periods.

Drilling Down and Exporting the Trial Balance
Click any GL account to drill into its transactions. Export as PDF or XLS via Download or Email Report.
Tax Details Report
The Tax Details report is a multi-tab Excel spreadsheet that contains everything you or your accountant needs for tax filing: income, expenses, mileage, assets, liabilities, and equity, each in a separate tab with full transaction-level detail.

Tabs included:
- Summary — high-level totals for income, expenses, mileage, and advanced transactions
- Business Income List — all tracked business income with GL account, source, date, amount, and client
- Other Income List — deposits categorized as Other Income
- Liabilities List — transactions tagged as Liabilities
- Business Expense List — all business expenses with category, tax category, GL account, vendor, receipt link, date, amount, and client
- Other Expense List — withdrawals categorized as Other Expense
- Assets List — transactions tagged as Assets
- Equity List — transactions tagged as Equity
- Business Mileage List — all tracked business trips with date, client, addresses, distance, and deduction
Access: Reports → Tax Reports → Tax Details (for Tax Filing) → set date range → Download (Excel only)
The Tax Details report is what most CPAs request alongside the Schedule C — it has the full amounts before any IRS adjustments.
Tax Form Reports
Money Pro generates draft versions of IRS tax forms pre-filled with your tracked data. These are starting points, not ready-to-file forms — they carry a Draft watermark.
| Form | Who it's for |
|---|---|
| Form 1040 Schedule C | Sole proprietors and single-member LLCs filing a personal return |
| Form 1065 | Multi-member LLCs and LLPs (pass-through entities) |
| Form 1120-S | S Corporations |
| Form 1120 | C Corporations |
Access: Reports → Tax Reports → select the form → set date range → Download (PDF)
IRS timing: The IRS typically releases updated form versions in the second half of the tax year. Until the update is available, Money Pro uses the prior year's form layout as a placeholder. The Draft watermark on all tax form reports is intentional — additional information is always required to finalize.
For a step-by-step guide to filing using the April integration, see How to File Taxes with Money Pro.
Full List of Available Reports
Money Pro organizes reports into seven categories. All are accessible under ZenBusiness Money → Reports.
| Category | Report | Format |
|---|---|---|
| Accounting | Profit & Loss | PDF, XLS |
| Accounting | Balance Sheet | PDF, XLS |
| Accounting | Cash Flow Statement | PDF, XLS |
| Accounting | Trial Balance | PDF, XLS |
| Expense | Business Expenses | |
| Expense | Business Expenses by Category | |
| Expense | Business Expenses by Client | |
| Expense | Business Expenses by Vendor | |
| Expense | Expense Details List with Receipts | XLS |
| Expense | Personal Expenses by Category | |
| Expense | Personal Expenses by Vendor | |
| Expense | Total Expenses from Recurring Vendors | |
| Income | Business Income | |
| Income | Business Income by Client | |
| Income | Income Detail List with Receipts | XLS |
| Income | Personal Income | |
| Invoicing | Aged Accounts Receivable | |
| Mileage | Business Mileage | |
| Mileage | Business Mileage by Client | |
| Mileage | Mileage Detail List | XLS |
| Mileage | Personal Mileage by Category | |
| Tax | Form 1040 Schedule C | |
| Tax | Form 1065 | |
| Tax | Form 1120-S | |
| Tax | Form 1120 | |
| Tax | Tax Details (for Tax Filing) | XLS |
| Time & Task | Business Time | |
| Time & Task | Business Time by Client | |
| Time & Task | Business Time by Task | |
| Time & Task | Time & Task Detail List | XLS |
How to Download or Email Any Report
- Go to ZenBusiness Money → Reports
- Locate the report and click View (to preview on-screen) or the three-dot menu icon
- Click Download or Email Report
- Set your Start Date and End Date
- Select report format (PDF or XLS, where applicable)
- For Email: add any additional recipient addresses
- Click Download Report or Email Report
Spreadsheet reports (XLS) can't be previewed inside Money Pro — download or email them to open in Excel or Google Sheets. PDF reports show a summarized view; the spreadsheet version has full transaction detail.
Frequently Asked Questions
Why does my P&L total differ from what I expected?
Most common causes: (1) The date range doesn't cover the full period you're thinking of — check that it spans January 1 to the current date or December 31. (2) Paid invoices without a matched payment aren't counted as income. (3) Transactions tagged to Bank Transfers or Equity don't appear in the P&L — they show in the Balance Sheet instead.
Why does my Balance Sheet show a negative equity balance?
Negative equity typically means you've withdrawn more from the business than you've put in or earned — common in early-stage businesses funded by owner loans. It's not necessarily a problem, but if you weren't expecting it, drill into the Equity section to see the transactions contributing to it.
My tax form report is using last year's form. Is that correct?
Yes, temporarily. The IRS releases updated form layouts in the second half of each tax year. Until the new version is available, Money Pro uses the prior year's form with a Draft watermark. The numbers in the report are current — only the form layout is from the prior year.
Why does the Tax Details report show different expense totals than the Schedule C?
Two adjustments: (1) Business meals — Schedule C applies the 50% IRS limitation; Tax Details shows the full amount spent. (2) Cost of Goods Sold — Schedule C separates it in Part I; Tax Details groups it with operating expenses. Both reports are correct; they just reflect different IRS presentation rules.
Can I run a report for a partial year?
Yes — use the custom date range when filtering any report. Useful for quarterly reviews, mid-year accountant meetings, or preparing quarterly tax estimates.
Can I export to QuickBooks or other accounting software?
Not directly. The XLS exports can be imported into most spreadsheet-based workflows, and your accountant can use them as source data. For native QuickBooks integration, contact our support team to ask about available integrations.
Related Articles
- Money Pro Tax Reports
- Quarterly Estimated Taxes in Money Pro
- How to File Taxes with Money Pro
- Expense Tracking in Money Pro
Still need help? Reach us via live chat on your dashboard or our support team.